After watching a stream where Matt Stauffer and Derick Rethans (the creator of Xdebug) discussed setting up Xdebug with Visual Studio Code, I decided it might be helpful to write a post on setting up Xdebug with PhpStorm, specifically if you’re running Laravel Valet.
This is both for myself for future reference, and for anyone who stumbles upon this post and finds it helpful. Without further ado, let’s get into it.
Xdebug 3.0 has now been released, and some changes have been made to this guide to reflect this change. If you’re looking to set up a different environment (or would like to see a video), take a look here.
Setting up Xdebug
Before we begin, I assume you have Laravel Valet installed.
Let’s make sure php and pecl are installed and linked correctly.
Assuming you use Homebrew, your terminal output will be:
$ which php
/usr/local/bin/php
$ which pecl
/usr/local/bin/pecl
Note: If you are on an Apple Silicon-based Mac and you installed Homebrew without Rosetta, the Homebrew binaries can be found in
/opt/homebrew/bin, as opposed to being located in/usr/local/bin. Paths referenced below might differ slightly if your Homebrew installation is located in/opt/homebrew.
Let’s also look at PHP:
$ php -v
PHP 7.4.12 (cli) (built: Oct 29 2020 18:37:21) ( NTS )
Copyright (c) The PHP Group
Zend Engine v3.4.0, Copyright (c) Zend Technologies
    with Zend OPcache v7.4.12, Copyright (c), by Zend Technologies
That means we’re on the right track so far. Next up, we’ll want to make sure to install the latest version of Xdebug via pecl.
$ pecl install xdebug
After running this command, running php -v should say:
PHP 7.4.12 (cli) (built: Oct 29 2020 18:37:21) ( NTS )
Copyright (c) The PHP Group
Zend Engine v3.4.0, Copyright (c) Zend Technologies
    with Xdebug v3.0.0, Copyright (c) 2002-2020, by Derick Rethans
    with Zend OPcache v7.4.12, Copyright (c), by Zend Technologies
Note: If you frequently switch between different versions of PHP, you may want to check out my Mac GUI, PHP Monitor. It’s totally free and open source!
There we go, Xdebug is installed. But we need to set it up with another port as well.
Additionally, if you see the following message (“Cannot load Xdebug - it was already loaded”) it’s probably because you have zend_extension="xdebug.so" in your php.ini file twice.
Let’s locate that file by typing php --ini, which will tell us where our ini files live:
$ php --ini
Configuration File (php.ini) Path: /usr/local/etc/php/7.4
Loaded Configuration File:         /usr/local/etc/php/7.4/php.ini
Scan for additional .ini files in: /usr/local/etc/php/7.4/conf.d
Additional .ini files parsed:      /usr/local/etc/php/7.4/conf.d/ext-opcache.ini,
/usr/local/etc/php/7.4/conf.d/php-memory-limits.ini
We’ll create our Xdebug configuration in a separate file. I’m creating a new file in the terminal and opening it with Visual Studio Code, but you can do this manually. Since the /usr/local/etc/php/7.4/conf.d directory is scanned automatically, we can put our Xdebug configuration here.
$ code /usr/local/etc/php/7.4/conf.d/xdebug.ini
This opens Visual Studio Code for me (I use it for light text editing that doesn’t require PhpStorm). If you don’t have the code alias configured, you can use nano:
$ nano /usr/local/etc/php/7.4/conf.d/xdebug.ini
In our main php.ini file, we’ll load the Xdebug extension (this was probably added automatically):
zend_extension="xdebug.so"
In our xdebug.ini file that we just created, we’ll set these:
xdebug.mode=debug
This allows us to specify what we want Xdebug to do; depending on the mode of operation Xdebug may do more or less work. Learn more about the this new configuration setting here.
If you need to debug said connection, you can add the following line as well:
xdebug.log=/tmp/xdebug.log
Note that this outputs the entire connection to the log, so once you’ve got PhpStorm up and running it’s recommended to turn this off, or you’ll see your disk slowly fill up with a huge logfile!
After all this, we’ll need to restart all of Valet, so let’s run:
$ valet restart
Go to one of your websites you’ve got setup and add phpinfo(); exit; to the PHP script, and check that Xdebug is configured correctly there as well by loading the page in your browser.
If the configuration isn’t correct yet, you may need to restart PHP & PHP-FPM, which you can also do like so:
$ sudo brew services restart php
To verify if Xdebug is set up correctly on the command line, you can run:
$ php --info | grep xdebug
This will output a whole lot of variables, but you can see all the relevant info, e.g. remote_enable and remote_port:
/usr/local/etc/php/7.4/conf.d/xdebug.ini
...
xdebug.mode => develop => develop
xdebug.client_port => 9003 => 9003
...
If you’re searching for a specific line, you can leverage grep as such:
$ php --info | grep xdebug.mode
xdebug.remote_enable => On => On
Setting up your browser
Next up, we’ll need to install the browser extensions for Xdebug. You can find the latest links on the official website. Pick the one for your browser. I’m using Firefox.
Once the plugin is installed, we can toggle whether we want to debug a website or not. How you do this precisely varies slightly per browser, but this is what it looks like on Firefox:
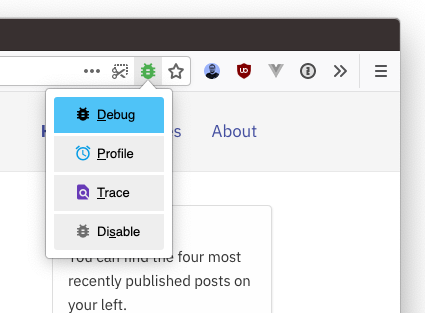
For the example here, I’ll be using my own website — which I have conveniently set up on nicoverbruggen.test locally.
Setting up PhpStorm
Note: I have made some changes to the default font inside PhpStorm. If your fonts and such looks slightly different, that’s normal.
Configuration
So, if you have a project open, you’ll want to change the Xdebug configuration in two places:
- In the current project
- In the project defaults (for future projects)
Let’s start with the current project, verify it works, and then set up that same configuration for new projects.
Go to your menu bar, select PhpStorm > Preferences…. Then, on the left, choose Languages & Frameworks > PHP. If you haven’t set it up yet, you’ll want to make sure the PHP language level is set correctly, and add an interpreter. This is not required for Xdebug to work, but it will help you during development, and if you wish to debug via PhpStorm (and not via the browser) you need a CLI interpreter.
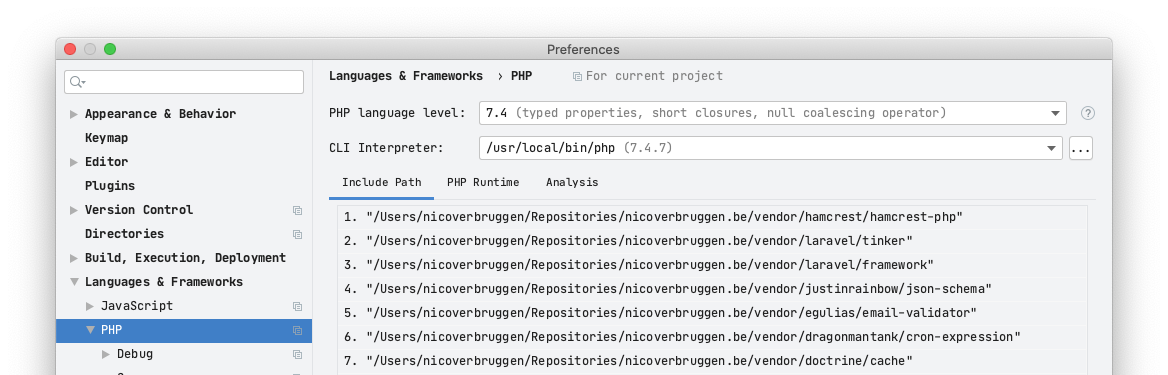
This is how I’ve set up my CLI interpreter:
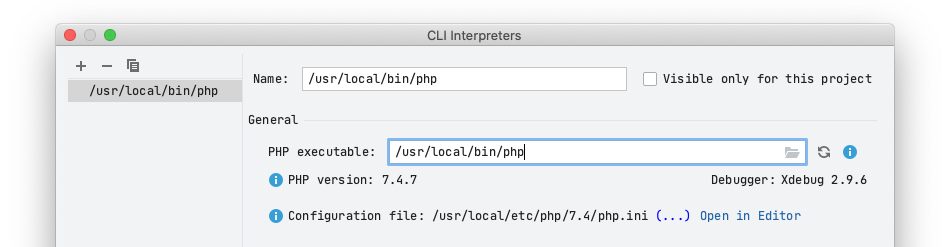
As you can see, PhpStorm has also noticed that Xdebug is active on my system since I’ve enabled the module in php.ini. For the most part, all you have to do here is point at /usr/local/bin/php and you’re golden.
Next up, we’ll need to set up the actual debugging environment, and make sure that we configure our server setup. The server setup will actually be done automatically once we start attempting to debug, so let’s continue.
Go to Languages & Frameworks > PHP > Debug, and change the port of Xdebug to 9003 (as we did before). Also make sure you enable the option “Resolve breakpoint if it’s not available on the current line” and “Can accept external connections”. You’ll also want to disable the options under “External connections”.
You can also enable Stop at First Line here (under External Connections), which the author of Xdebug recommends you keep on for the first few sessions.
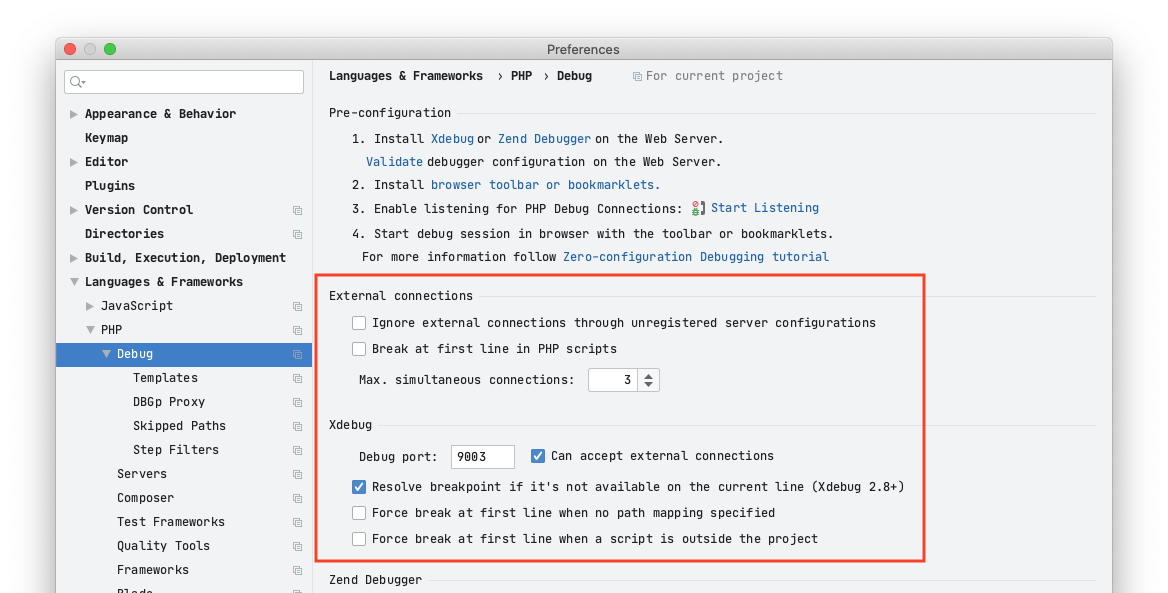
Make sure to apply these new settings!
Technically speaking, we’re ready to start listening for connections. Forget all that nonsense about IDE keys and such, you don’t need that for this relatively simple setup.
Once you’ve established that this configuration works for you later, I recommend that you modify the ‘global’ configuration by going to File > New Project Settings > Preferences for New Projects… and making the same changes there.
Okay, so all that remains now is to:
- Start listening for Xdebug
- Enable debugging via the browser plugin
- Set a breakpoint
You can start listening for debugging by going via the menu: Run > Start Listening for PHP Debug Connections. Enable that now.
Next up, we’ll enable debugging in the browser for the URL we’re testing, as seen in the screenshot earlier under the “Setting up your browser” section.
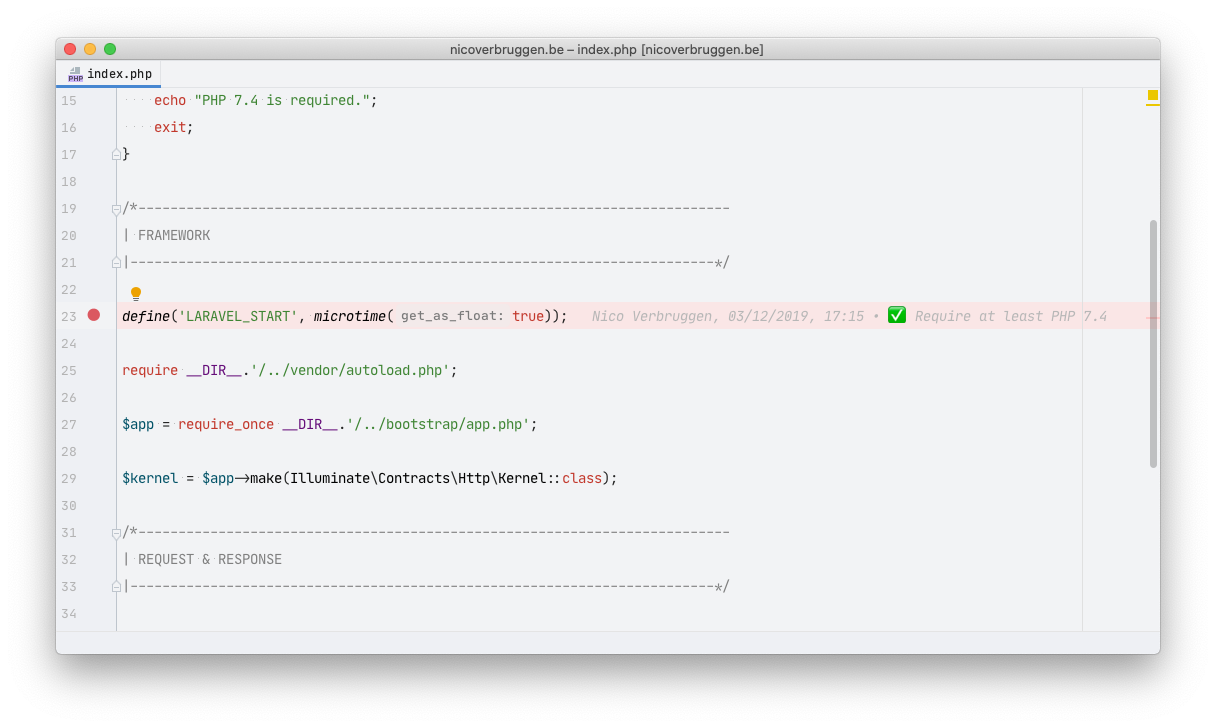
Finally, we’ll set a breakpoint somewhere in a file. For this example, I’m using index.php under the /public folder, since that’s what’s executed first.
You can set a breakpoint by clicking inside the gutter to the right of the line number, e.g.:
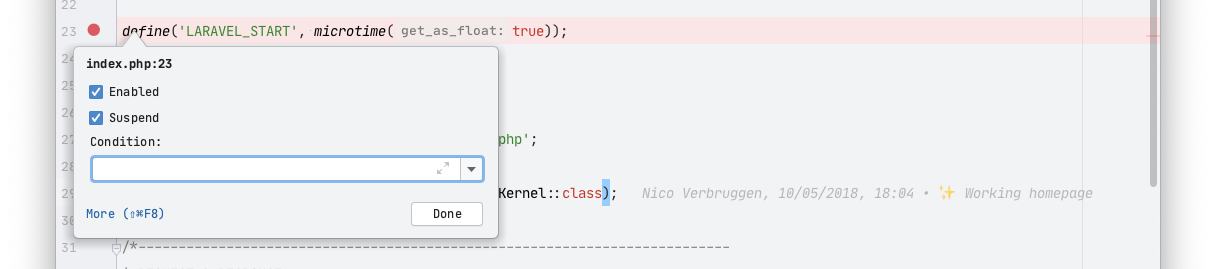
Additionally, if you right-click on the red dot, you can specify a specific condition you wish to debug:
Okay, let’s go back to our browser and load the homepage. At this point, PhpStorm should tell us that there’s a new incoming debug connection and asks us if we wish to accept it:
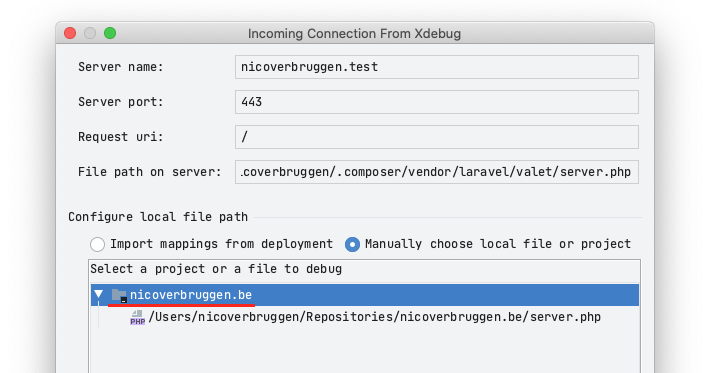
It’s very important that you click on the project here, and not on the individual file. That way the entire project is mapped, and upon clicking on Accept, your breakpoint should be hit.
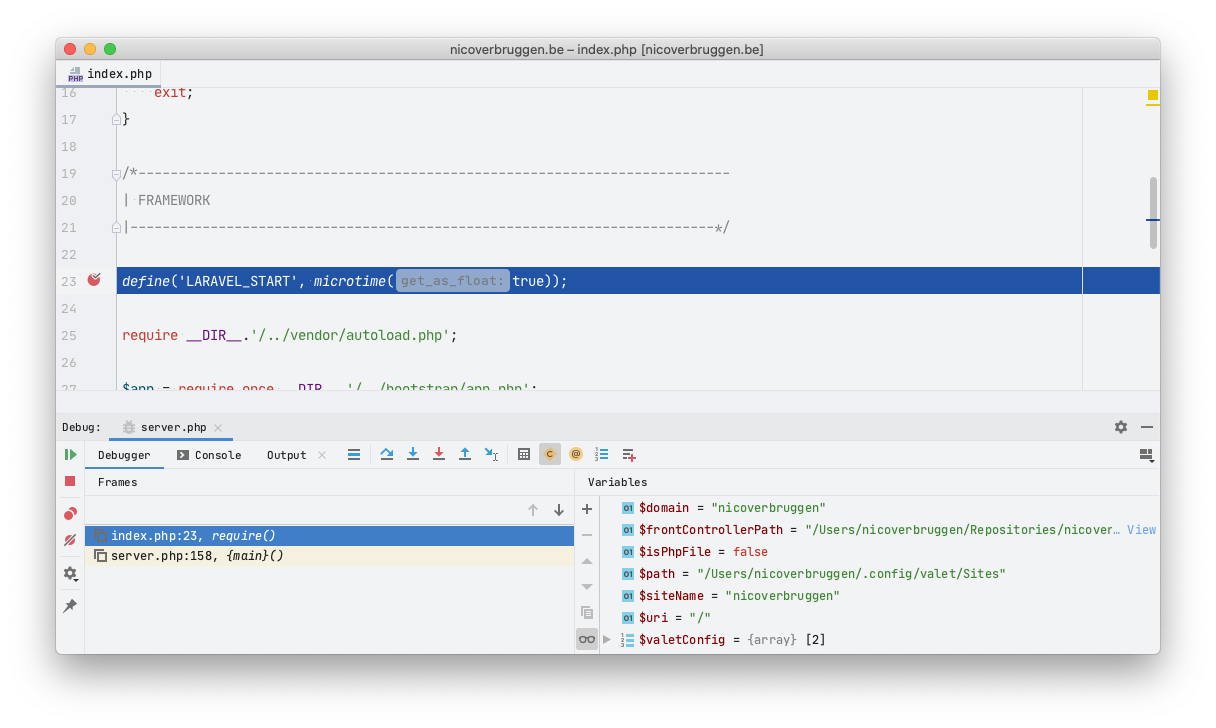
At this point, you can debug the entire application by stepping through your code (or vendor code), and you have access to a powerful suite of debugging tools.
The most important thing you’ll probably be doing is jumping through the frames (left) and inspecting variables (on the right), as well as jumping through the code.
This is what I need the most:
- Step Over: Jump over the given line (meaning a function will be executed but we won’t see the inner working of a function)
- Step Into: Jump into the specifics of the line (if a function is called, we’ll jump into the function so we can see what happens there)
- Resume Program: This continues execution of the script, but retains any changes you may have made to the variables
Note that the connection between nginx and php-fpm might time out: you might see a timeout in your browser if you take too long debugging.
For additional information about the debugging workflow in PhpStorm, I recommend checking out JetBrains’ official documentation here.
I’ve been using a debugger for a long time in Xcode and I think you are missing out if you don’t have this tool available in your toolbelt. Xdebug will slow down your applications, so take care to disable it when you don’t need it!
For those of you that live in the Laravel and Symfony ecosystems, the var-dumper package is fantastic, but this is a more powerful tool you should consider using, especially if you’re debugging a complex issue. It’s absolutely helped me in various situations! :)